


So You Think Housing Market is About To Crash? Think Again: 5 Graphs That Show Otherwise
Interest rates are on the rise… gone are the historical mortgage rates in the 2-3% range which have recently climbed to the 5% mark leaving first time home buyers and investors re-considering whether now is the best time to buy.
Add to that trend the fact that homes have increased in value over 20% annually for the past 2+ years boosted by inflation, cost of labor & materials, and limited supply while demand has stayed strong during the COVID pandemic.
Don’t believe us? Here’s a sample of 4 Western states and home value increase in the last 12 months:
Arizona: 29.9% increase
California: 20.5% increase
Colorado: 23.0% increase
Nevada: 28.1% increase
USA: 20.6% increase
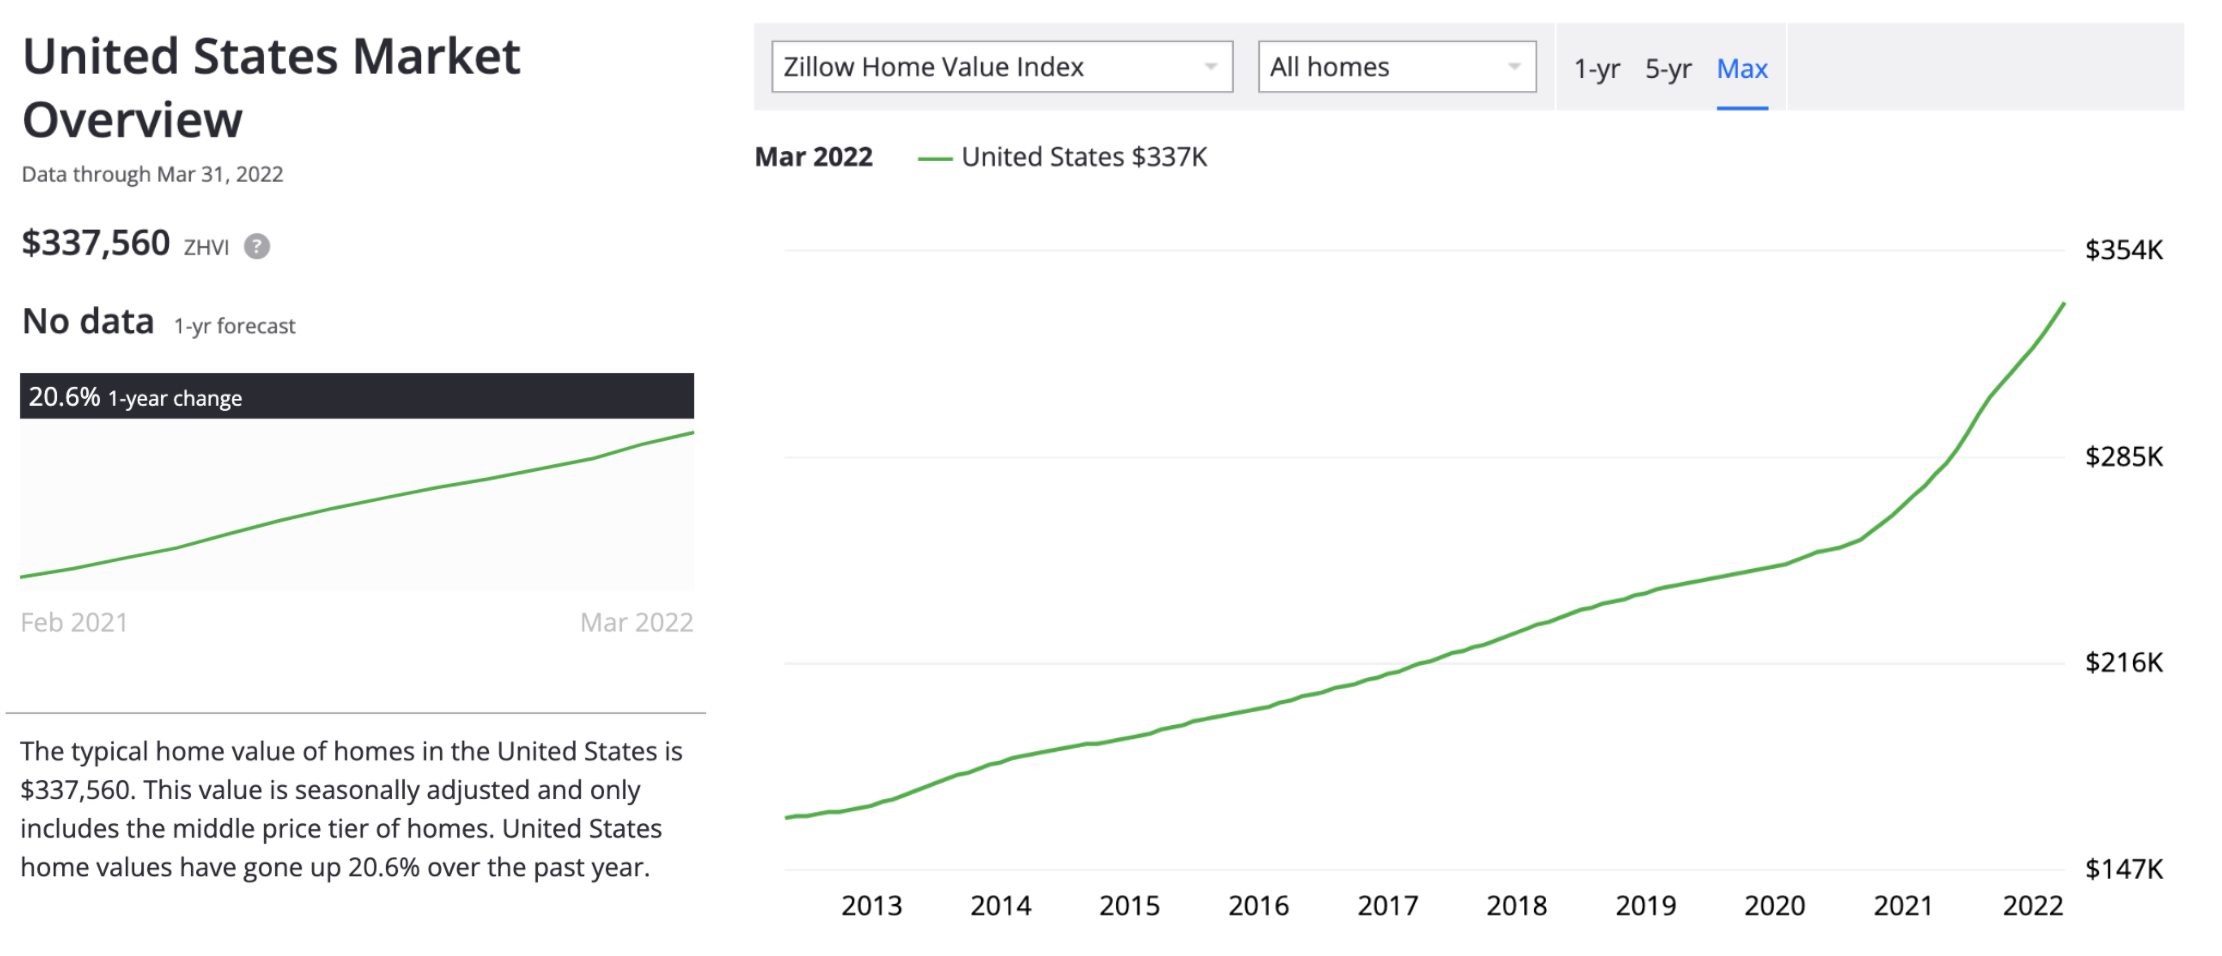
Source: Zillow Home Value Index, March 2022.
Speculation abounds, but the general consensus around is there’s no market crash à la 2008 in sight. Let’s look at the economic signs and numbers that differentiate today’s environment from the infamous 2008 housing market crash.
How much can you afford to buy right now?

Rapid Home Value Increases: Signs of a Market Crash?
Looking at the rapid increases in home prices as an isolated indicator would make any one worried about the future of affordability and purchase capacity for first time home buyers. Moreoever, when you look at increases in mortgage rates as well as dwindling inventory, you can’t help but jump to negative conclusions of the inevitably uphill battle for home buyers.
The sharp rise in mortgage rates we have observed in 2022 has led to an increase of $250-350 more per month on the purchase of a home priced around $350,000. “As Americans contend with historically high inflation, the combination of rising mortgage rates, elevated home prices and tight inventory are making the pursuit of homeownership the most expensive in a generation,” Freddie Mac chief economist Sam Khater said last week.
But is this enough to signal a market crash?
FannieMae economists strongly believe it is not. In fact, they predict a sharp decrease in home value appreciation into more “normal” single digit %s starting in this quarter (Q2 2022). But what is significant about the following graph is that the projections never hit 0% or negative home value increases in the next 2 years.
For would-be homebuyers that feel priced out of the market, the good news is that home price appreciation are expected to make a rapid plunge back to the single digits, down from a record 19.8 percent during the first quarter of this year to 6.5 percent by the first quarter of 2023 and 3.2 percent by the final three months of next year.
YOY Actual & Projected Home Value Appreciation
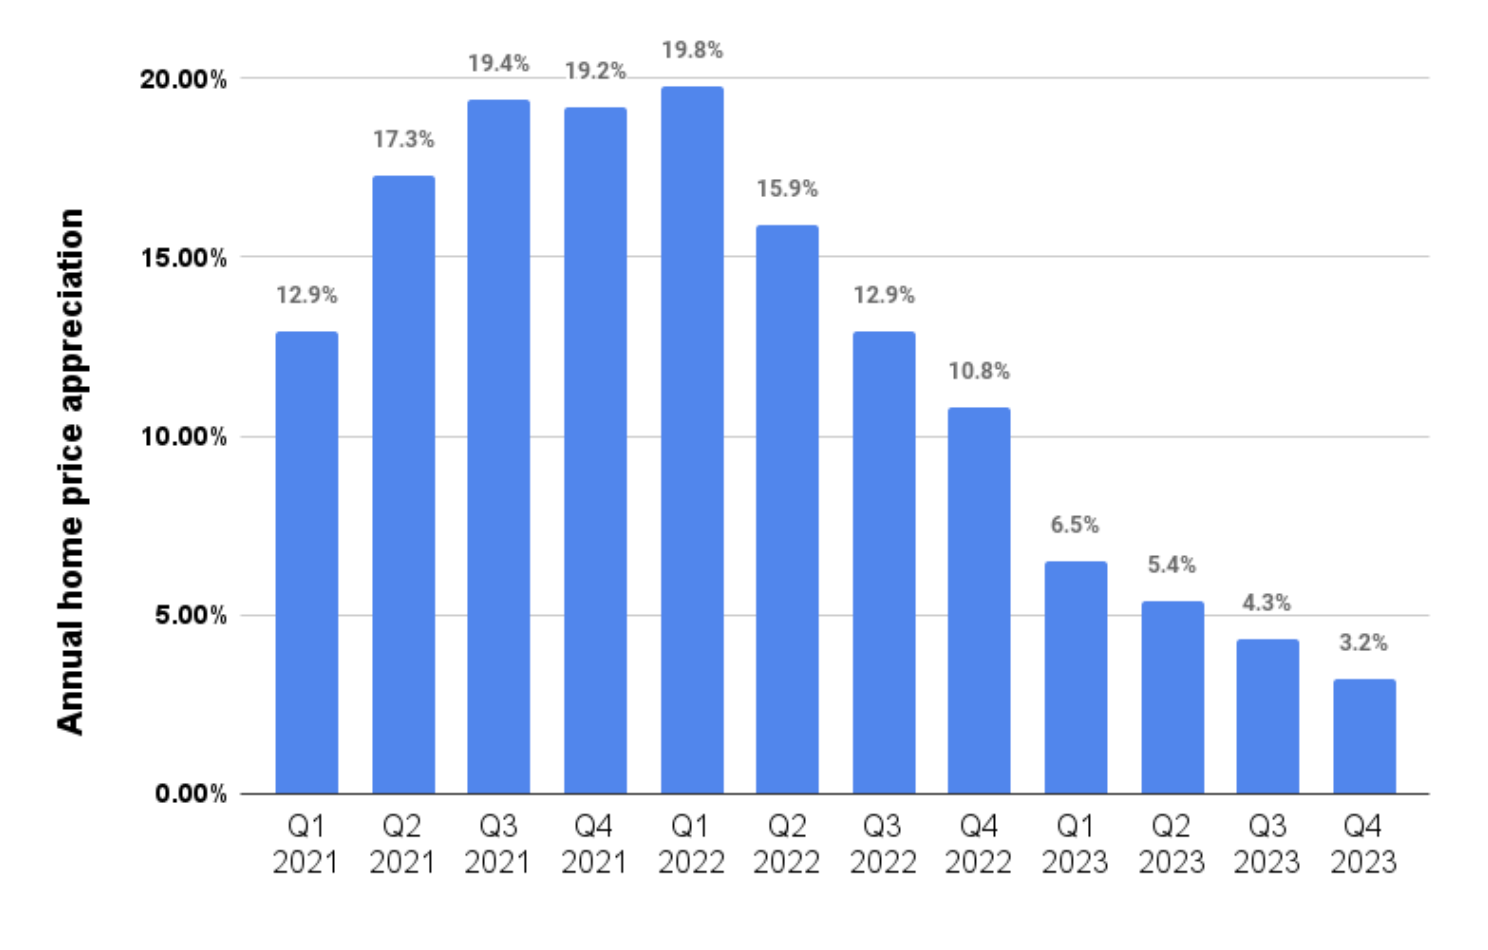
Source: Fannie Mae Housing Forecast, April 2022.
Mortgage Rates Climb Back Up Above 5%
The Federal Reserve has consistently and broadly signaled that multiple increases in the base interest rates are necessary to curb inflation and limit recessionary trends. Fed’s Jerome Powell confirmed expectations of half-point rate rise in May after their first adjustment earlier this year.
This has made the market adjust early with your average 30-yr mortgage fixed rate cross the 5% mark recently, 2 full percentage points higher than the 3.11% we had back on Dec 31 of 2021. Will this deter home buyers from entering the market? Certainly! Those who are borderline approved to buy a home will see their maximum purchase power decrease, all other variables staying equal, forcing these buyers to look at lower price homes that may not meet their needs. That is enough to push many buyers out of the market.
But will the decrease in demand be enough to cause a market crash? It does not appear so. In fact, both the National Association of Realtors and FannieMae project a volume of sales to stay high in the next 2 years, although not as high as initially projected.
FreddieMac Primary Mortgage Market Survey®
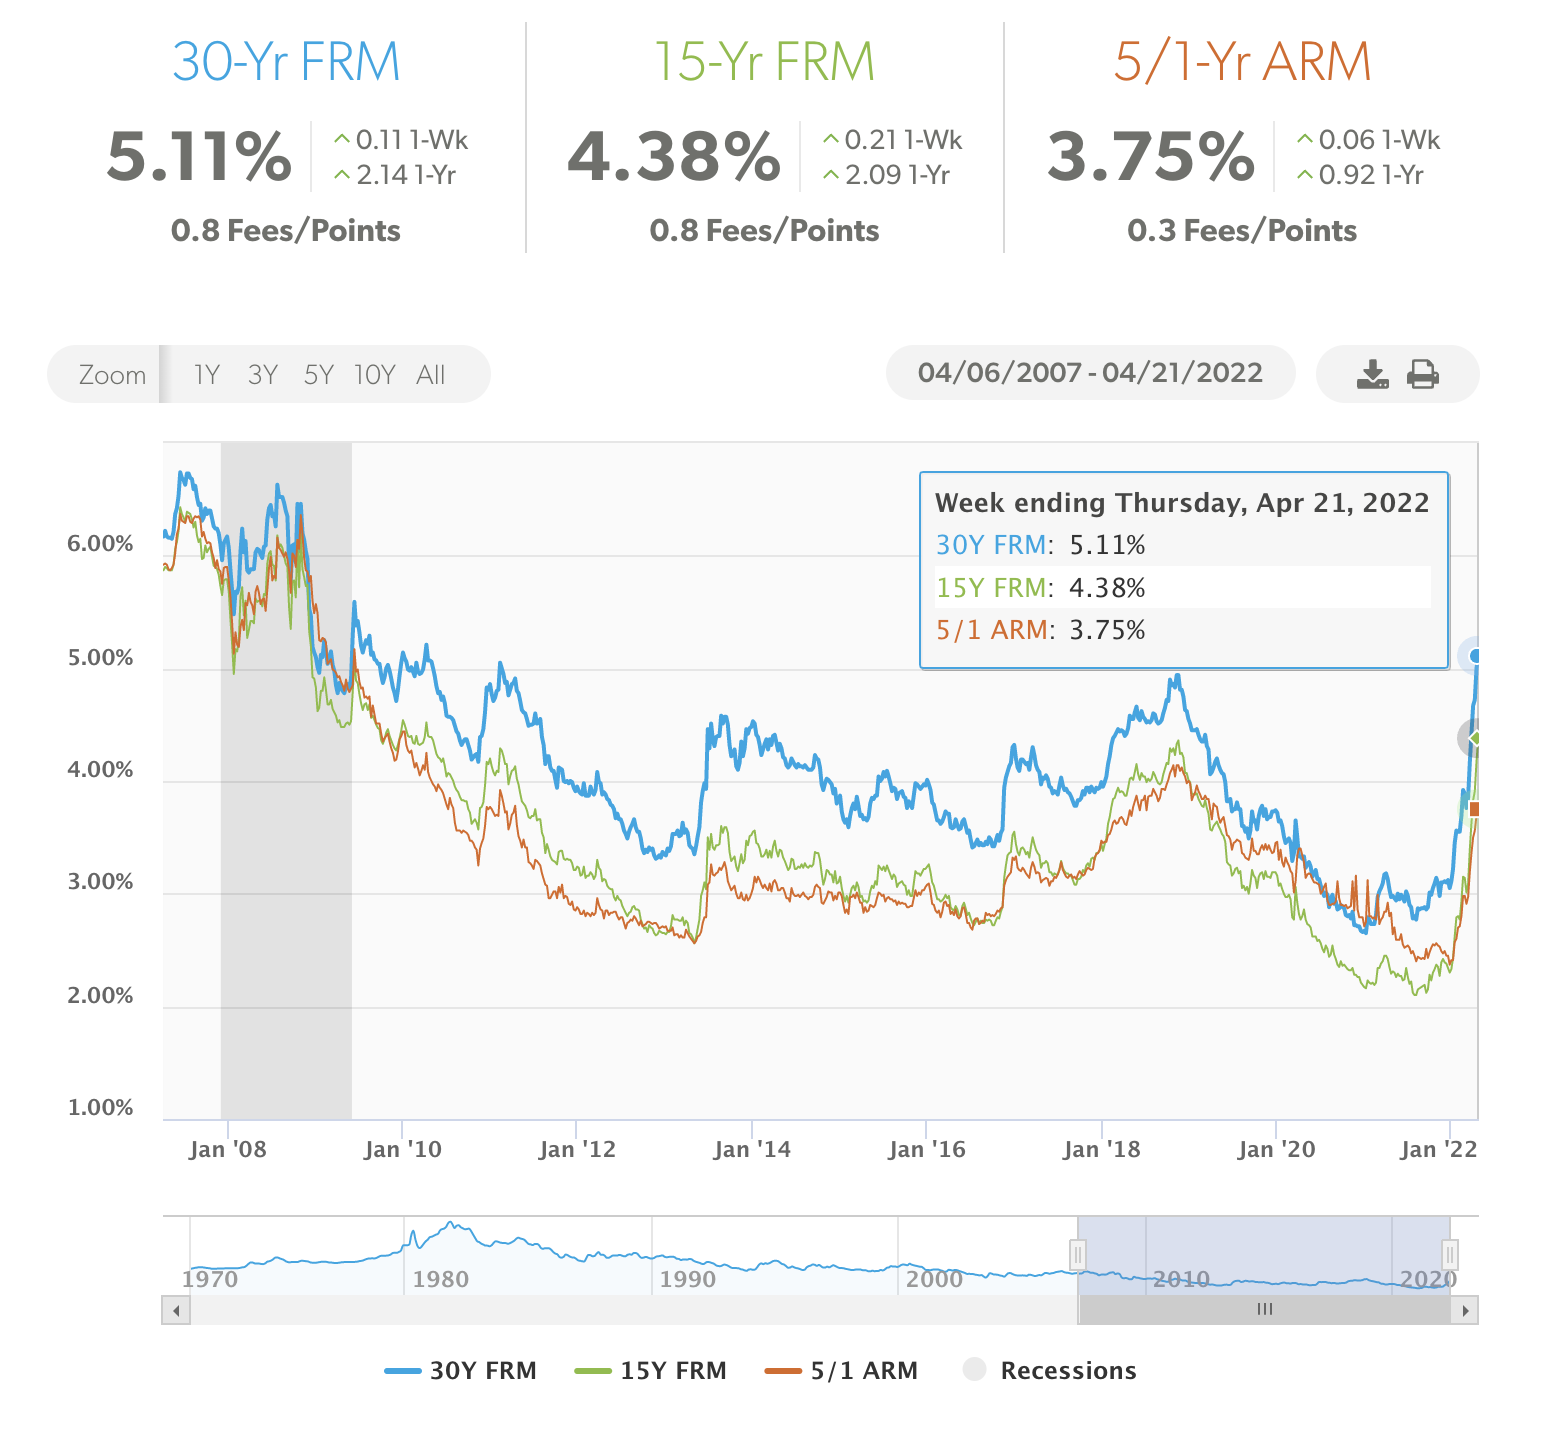
Source: FreddieMac, U.S. weekly averages as of 04/21/2022
Home Sales Will Remain Strong through 2023
Fannie Mae economists predict that at worst, we will have a ‘modest recession’ in 2023. That’s far from an apocalyptic market crash many seem to be predicting without much data to back such a projection.
In this scenario of a ‘modest recession’, home sales are expected to decline by 7.4% this year and 9.7% in 2023
The bottom line is, that even in a recessionary scenario for 2023, Fannie Mae economists don’t expect it will be as severe or as long as the Great Recession of 2007-09, due to “multiple factors.”
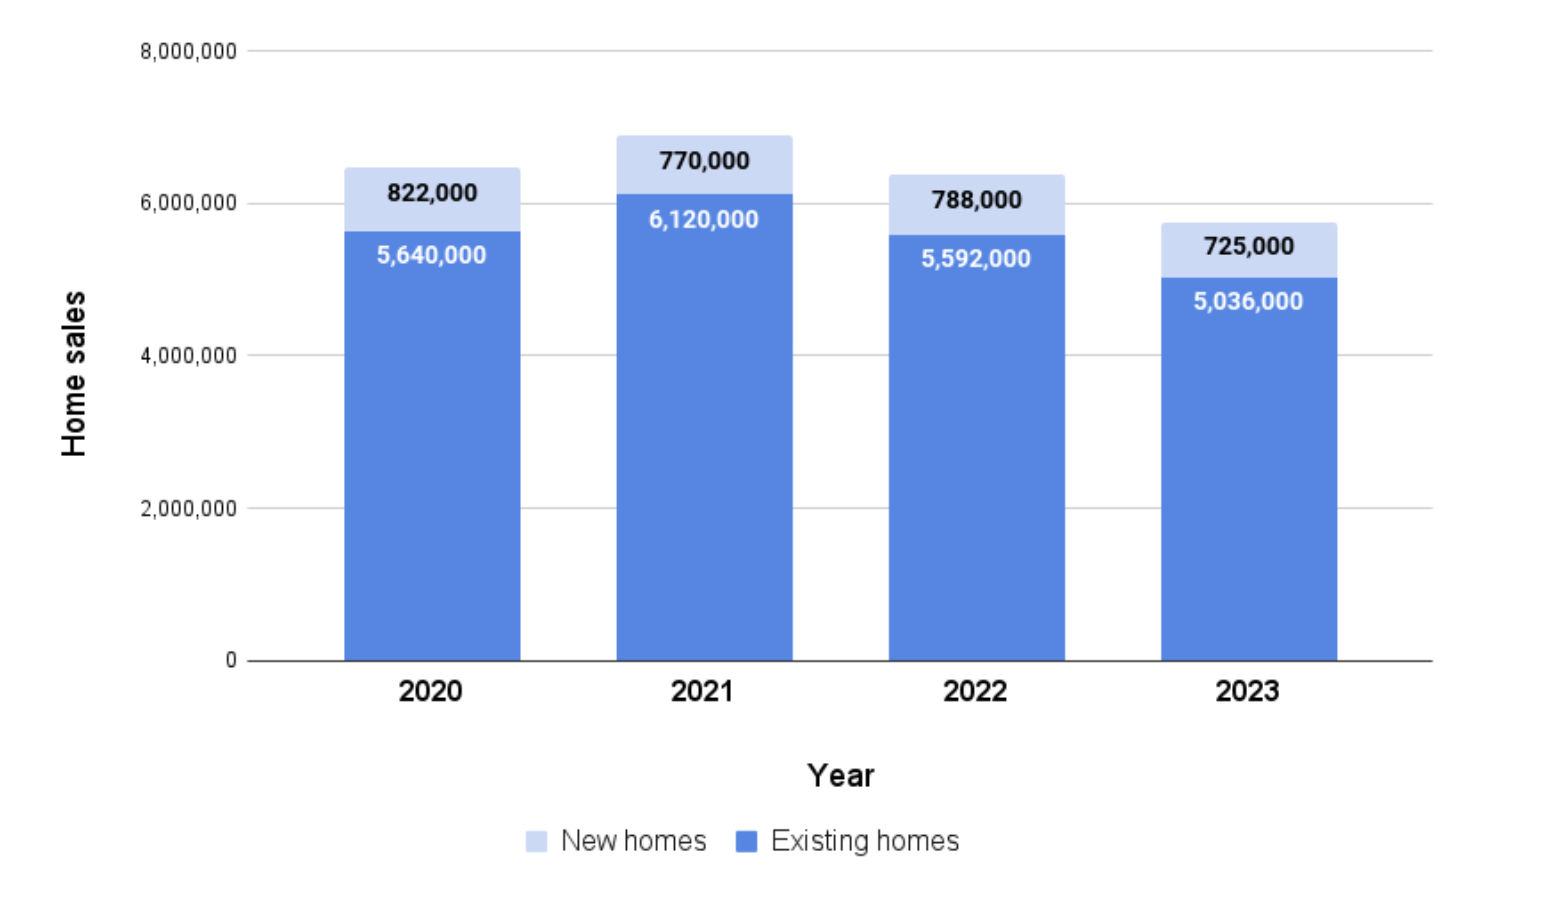
Source: Fannie Mae Housing Forecast, April 2022.
Home Prices Are Beginning to Adjust Down More Frequently In Active Listings
The median price of an existing home sold in March was $375,300, 15% more than March 2021. That’s the highest median price ever recorded by the National Association of Realtors.
The online listing giant Redfin says interest rates are pushing down home prices, but the market is still mostly hot.
Buyers looking for a less sizzling home market might finally be seeing some in the form of falling home prices.
According to Redfin, 13% of home listings on its site had dropped their price during the four weeks ending April 10. That’s up from 10% a month earlier and 9% from the same period a year ago. The big listing service says this is occurring during a season when price drops are typically fewer, and that it’s the fastest the share of price drops has grown this time of year since at least 2015.
More recent weekly housing data from Realtor.com suggests that supply may be on the upswing, with increases in fresh listings.
Increasing supply plus downward pressure on home prices equal better opportunities for home buyers.
The other aspect of home prices is cost of labor and cost of materials. The lack of labor during COVID as well as increasing prices of essential construction materials such as wood will continue to put inflationary pressure on home prices.
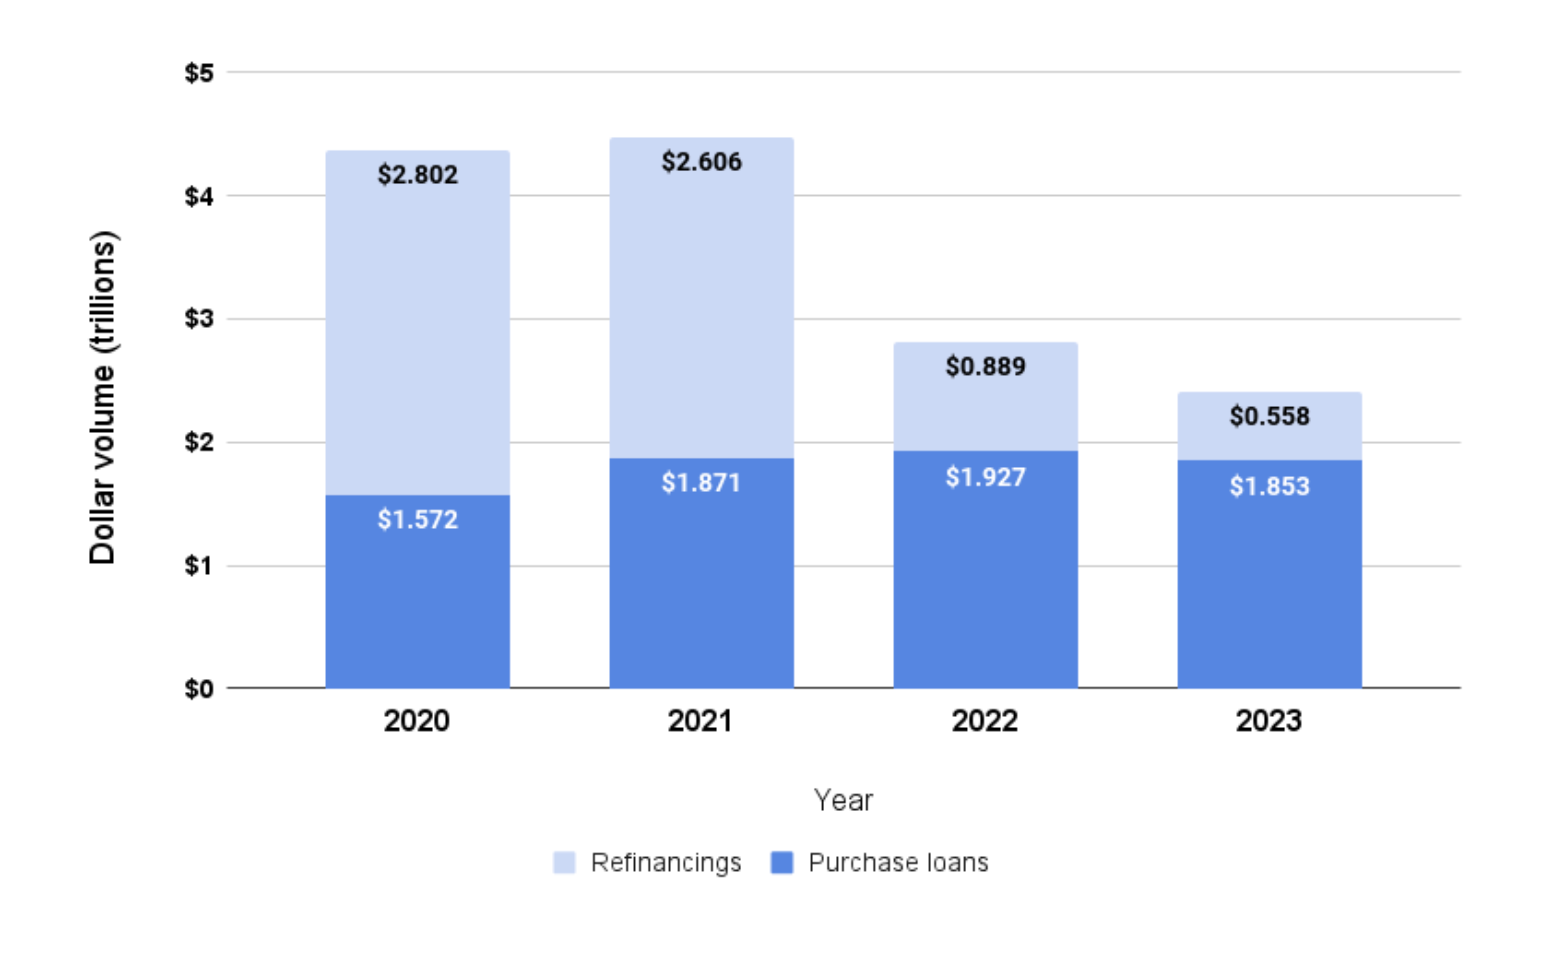
Aggregate Demand for Home Purchase Mortgages Will Remain Similar to 2021
With rapidly increasing rates, the window of opportunity for refinancing has closed down faster than any one expected. But will the same effect be there for purchases? FannieMae Economist strongly believe that investors and well qualified home buyers will make up the potential decrease from first time home buyers exiting the market.
Source: Fannie Mae Housing Forecast, April 2022.
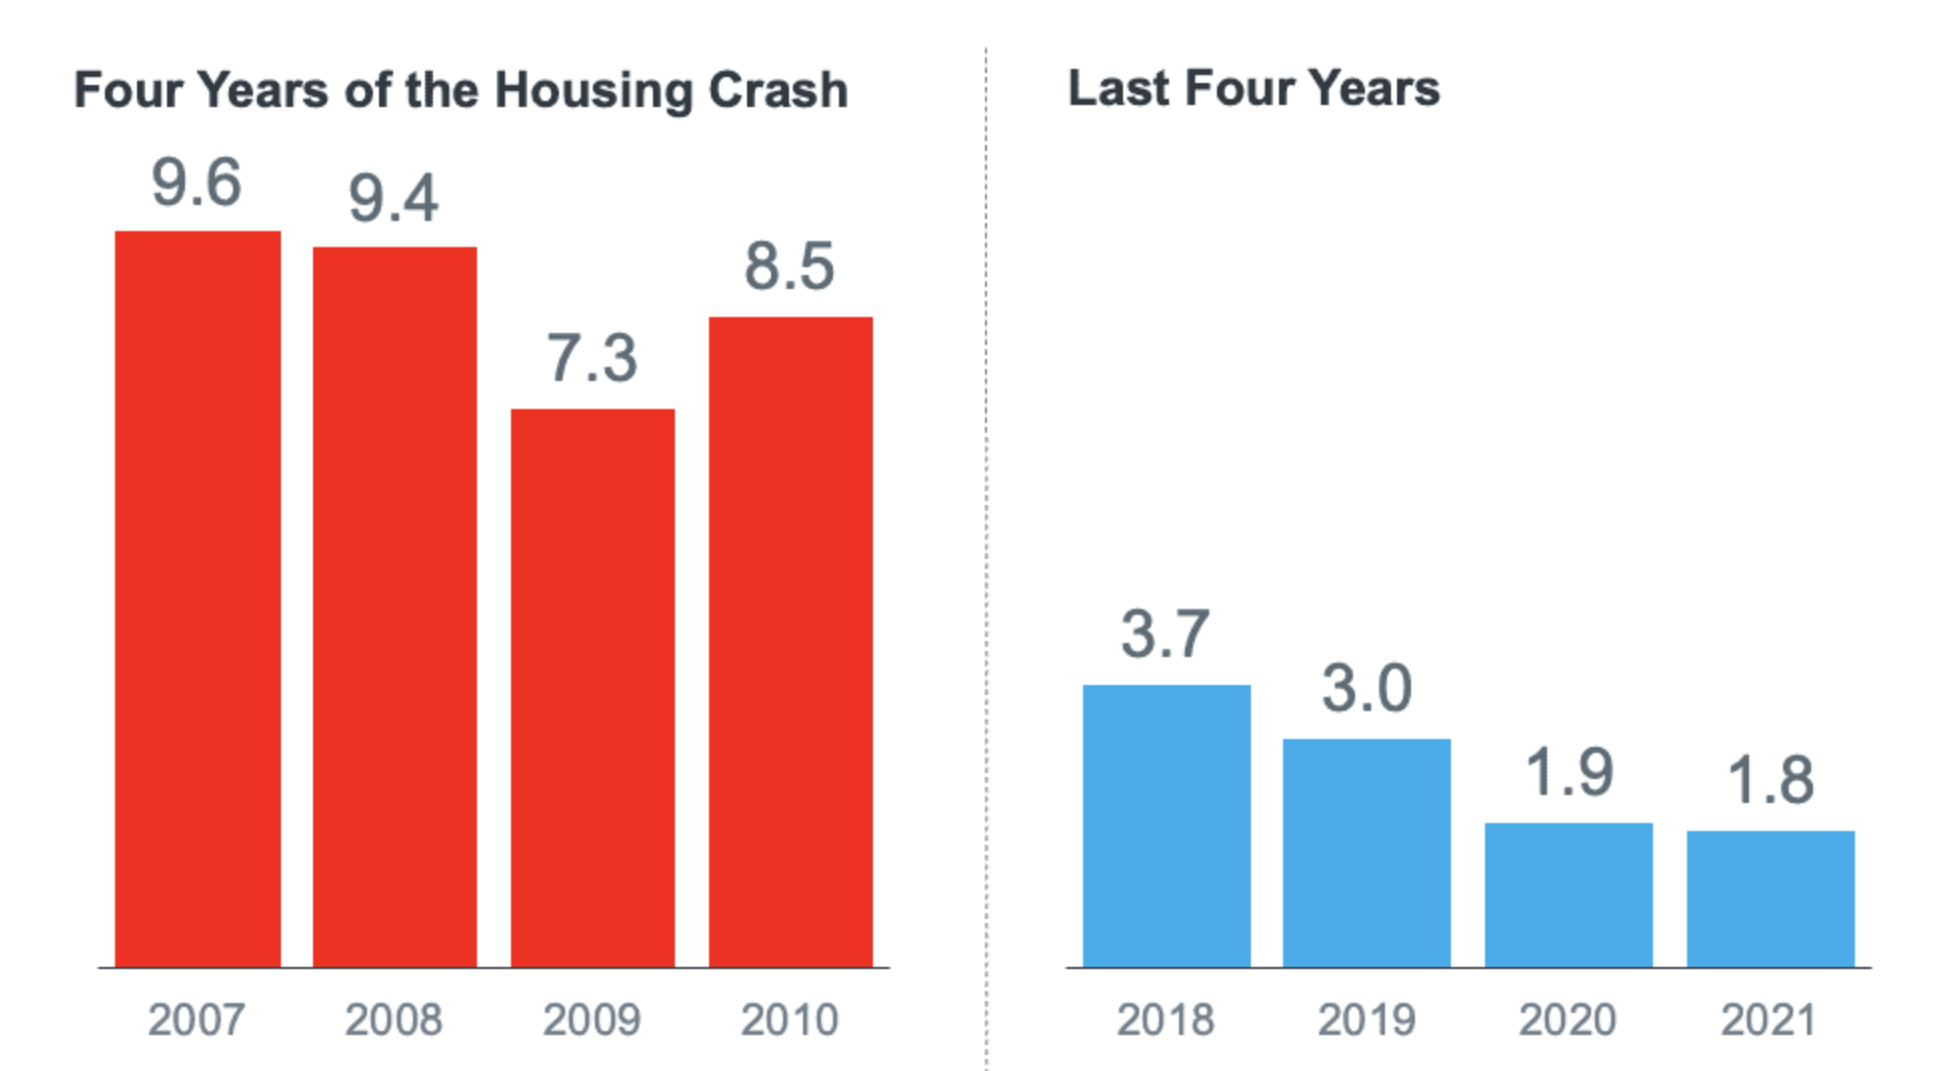
Supply of Homes Remains Low, 3-4x Lower than 2008 Pre-Market Crash
A major differentiator is that in 2008, we had a surplus of homes on the market. Today, we have a shortage.
According to Keeping Current Matters and the National Association of Realtors, he supply of inventory needed to sustain a normal real estate market is about six months. Anything more than that is overabundance that causes prices to depreciate. Anything less than that is shortage that leads to continued price appreciation.
Around the market crash of 2008, there were too many homes for sale from 2007 to 2010 including a bump in inventory from short sales and foreclosures. Today, there’s a shortage of inventory which could be a factor considered by FannieMae in their predictions of home values not depreciating any time soon.
Months Supply of Existing Homes for Sale in December of Each Year
Source: National Association of Realtors & Keeping Current Matters
In addition, inventory will not be shooting up as some predict. Historically low rates for almost 2 years during COVID and rising mortgage rates in 2022 and 2023 will not be helping the already tight housing inventory in many markets.
“Households with a 3 percent, 30-year, fixed-rate mortgage are unlikely to give that up in favor of a mortgage closer to 5 percent, and we expect this so-called ‘lock-in’ effect to weigh on home sales,” Fannie Mae Chief Economist Doug Duncan said in a statement. “Moreover, if mortgage rates remain relatively elevated, we expect the added affordability constraint to price out some would-be first-time homebuyers and contribute to the slowing of demand.”
Investors Are Slowing Down, but Not Leaving the Market Entirely
A sign of a strong housing market is investors’ appetite for buying single-family residences away from consumers. After a year of increased interest from investors, they recently showed the first signs of slowing down in the fourth quarter of 2021.
After hitting historical peaks in the second and third quarters of 2021, the share of homes purchased by investors reached a peak last October at 26.9% of total home sales: that’s MORE than a quarter of sales, according to CoreLogic. By November, the data showed the first decrease in investor share of total home purchases since July 2020 when the share of single-family acquisitions made by investors fell to 25.5%. That this decline was a first indication of a bigger drop in December when the investor share of home purchases fell to 20.4%.
Share of Home Purchases Made by Investors by Month (Jan 2019 – Dec 2021)
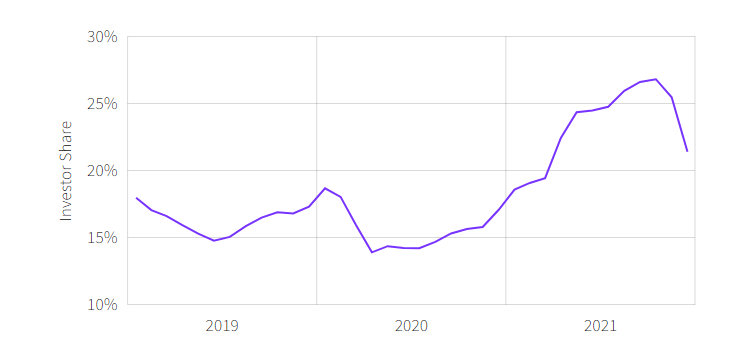
Source: CoreLogic Historical Home Buying Data
Conclusion: Market Crash? What Market Crash?
In conclusion, there are many indicators that make our current economic environment VERY different than 2008, and therefore is less likely to predict a housing market crash like the one experienced back then.
Strong indicators of continued activity in the housing market, improving home values, healthy demand, and scarcity in supply, indicate a continuation of a steady housing market albeit at less maddening levels as during COVID. Even if these indicators and experts are overly optimistic, no scenario put forward by respectable housing market institutions shows a severe decline in home value or prices.
It’s important that every family determines the best time for them to purchase a home.
But waiting for the market to crash or timing the market will most likely prove to be a losing strategy.
Browse Homes For Sale: