


New Constructions are No Longer Affordable
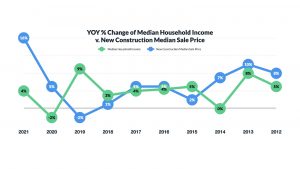
The increase of new construction homes is overwhelmingly outpacing America’s national average household income. The national average household income has dropped 2.9% from 2019 to 2020 to $67,521. This is the first decline since 2011, with a small rebound in 2021. The average price for new construction homes in America is $390,900, recorded in August.
Interested in a new construction home or remodel project?

“Affordability remains a challenge, even with mortgage rates near historic lows; if the pace of income growth doesn’t keep up with inflation and interest rates rise more than expected, we’d expect housing activity to slow from our current projections” says Fannie May’s Chief Economist, Doug Duncan.
Fannie Mae lowered the 2022 new construction home sale predictions in September from 846,000 to 789,000. This can be credited to record home price issues and building supply restrictions. This drop could potentially have consequences in the future, causing issues with recovery due to under-building.
The shortage in housing supply will undoubtedly disproportionally affect lower-income homes in 2022. It is estimated that the “households in the bottom 25th percentile of income [will] face a shortage of 2.6 million units versus those above the median income expected to face a gap of 650,000 units.” For example, a household income must typically fall under $80,000 to pay for a mortgage on a $390,900 home with a 6% down payment. At this rate about 60% of American households would not be eligible to purchase a home.
Knock completed an analysis on the top metro areas in the nation with highest percentage of new construction sales to understand affordability issues. Their findings are listed below:
- “Sacramento (80%), Miami (80%), Las Vegas (65%), Phoenix (63%), and Denver (62%) have the highest percentage of households unable to afford new construction.
- San Antonio (49%), Oklahoma City (50%), Raleigh (50%), Minneapolis (51%), Atlanta (52%), and Dallas (52%) provide the most accessible new construction for homebuyers.
- Metro areas showing the smallest premium for new construction to existing homes include Nashville ($1,300), Raleigh ($4,970), Denver ($9,013), San Antonio ($9,200), and Dallas ($9,847).
- Those showing the largest premium between new and existing homes include, Miami ($310,000), Baltimore ($186,726), Austin ($126,192), Indianapolis ($109,185), Washington ($100,000), and Sacramento ($100,000).”

60% of home buyers in the market prefer a new construction over an existing home, according to he National Association ofHome Builder’s 2021 survey What Home Buyers Really Want. First-time homebuyers, who historically struggle to save enough for a down payment are certainly most affected by the housing price increase. This means that it is even harder to afford a new construction for a first-time purchasers than current homeowners to buy a second or new home.
During the first 10 months of 2021, the average purchase price for first-time homebuyers was $229,000. This price range makes up less than 16% of the new construction market as of August, although the first-time homebuyers make up almost one third of all homebuyers. Based on median household incomes, Knock calculated the average time to save for a down payment on new construction homes for first-time homebuyers is 15 years.
- “The areas with the shortest down payment savings time are Houston, Oklahoma City, San Antonio, and Atlanta at just 12 years.
- Those with the longest savings periods include; Miami(30), Sacramento(21), Las Vegas(18), and Phoenix(17).
- In metro areas with below-average levels of new construction transactions, saving’s periods rise significantly. Ranging from 115 years in New York, to 127 in San Jose, 153 in Los Angeles, and 167 years in San Francisco. “
These insane saving periods truly represent the affordability crisis for average first-time homebuyers to be able to join the market and become homeowners in pricy metro areas.
 According to Zelman & Associates’ research, these affordability issues are occurring during a time where the share of smaller inventory homes built by new construction builders are at a all time high. “Homes built in the 0-2,249 square foot range have reached 60% of all homes built in the 10th largest markets in 3Q21, a 35% increase from 1Q15. In terms of the average square footage of single-family housing starts, a decline from 2015 to the present has occurred from 2,689 to 2,477 square feet in 2020 amidst surging new home prices. This trend has begun to reverse in 2021, showing growth to 2,513 square feet and, is projected to continue into 2023. The move to larger homes could further impact the average home price over time.”
Supply chain issues that have been affecting the country combined with affordability problems that were already happening to new construction homes questions the notion that new construction homes bring relief to the housing market pre-Covid. Benefits of the additional inventory will be felt disproportionately all over the country and will affect the smaller building gap more than expected if the new construction homes do not correct their alignment to homebuyers. Moving forward, we can hope and possibly expect a push in median prices for new construction homes hitting the market as the reality of becoming a homeowner is becoming seemingly out of reach.
Want to take advantage of low rates?
Source: Knock